 |
<--- Main log-in screen |
|
<--- Main log-in screen |
 |
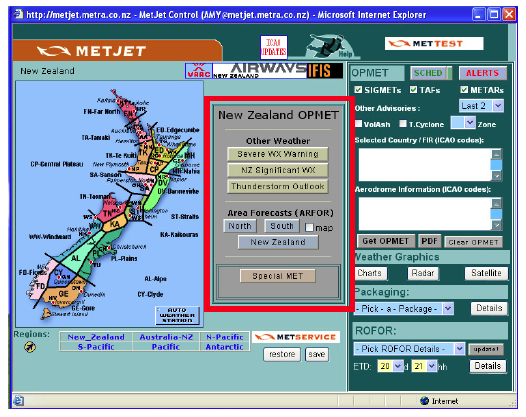
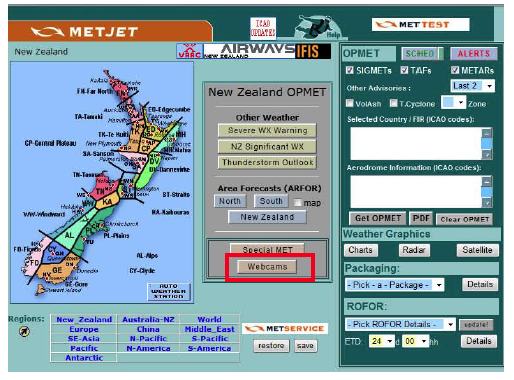
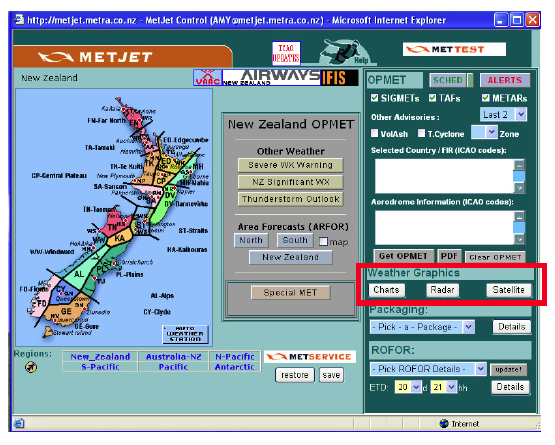
<--- Main MetJet screen |
 |
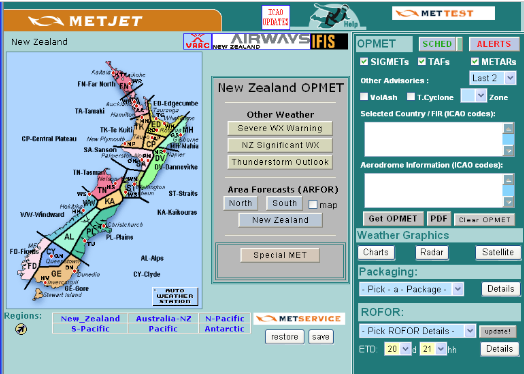
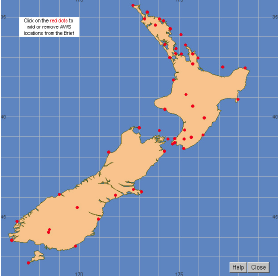
<--- Map Selection |
Moving the cursor over the countries displayed will bring up the name of the country.
(available when NZ map is selected)
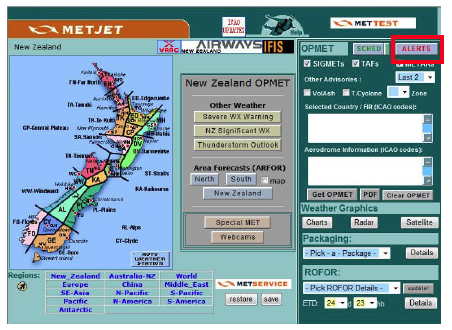
The map of New Zealand is divided into specific coloured areas called Aviation Areas. Aviation Area Winds are produced for each area. A Graphical Aviation Forecast (GRAFOR) is available for the entire country, available for 2-3 different time steps depending on the time of day, and the latest GNZSIGWX chart depicting 'moderate' intensity hazards and GSM (Graphical SIGMET Monitor) will also be displayed.
Embedded in each area are selected Aerodrome Forecasts (TAFs), and Manual Observations (METARs/SPECIs) or Automatic Weather Station reports (AWS') in METAR code format.
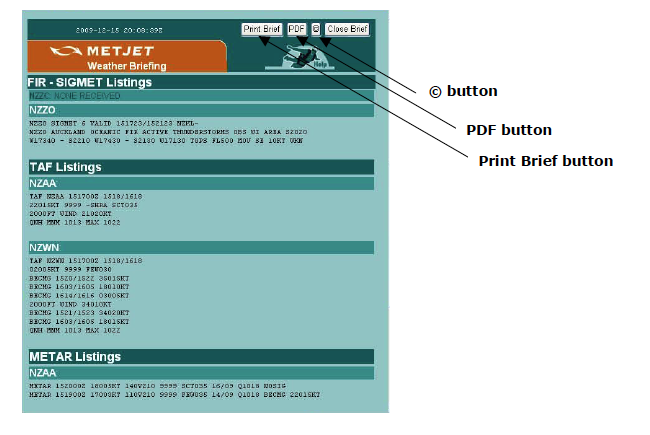
When the information you have requested is displayed in a new window you have the option to view, print or save this.
To print the information click the Print Brief button.
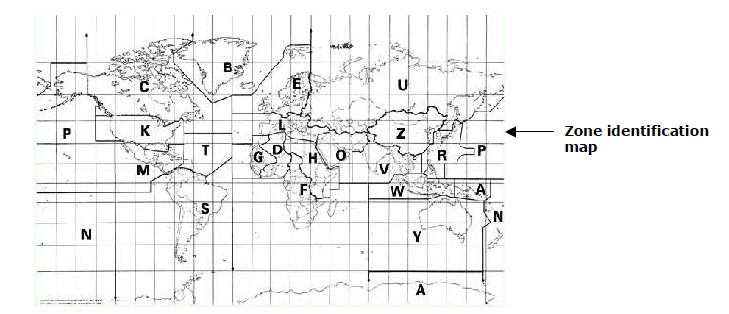
The letters refer to the various zones as defined in the 'Index to Identifying Letters assigned to Aeronautical Fixed Service Routing Areas of States' as published by ICAO.
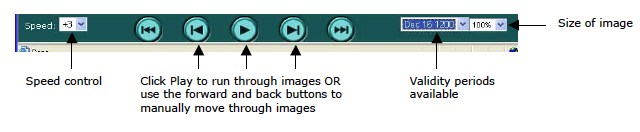
All charts, Radar and Satellite imagery use standard video control buttons to navigate through available images (unless a single image is selected to view).
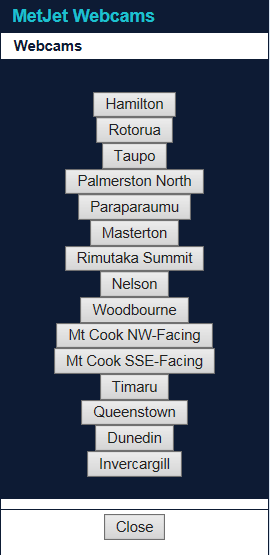
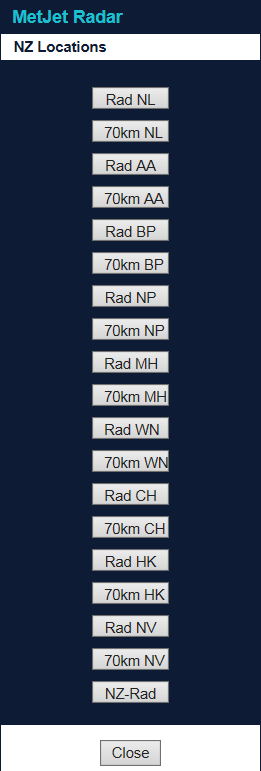
Weather graphics can be viewed by clicking on the Charts, Radar or Satellite buttons on the right hand side of the screen.
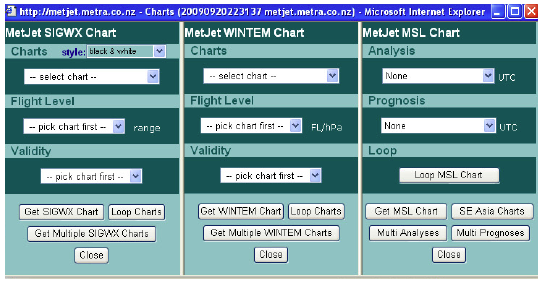
Use the drop down menus to select the area/region you want, the flight level and the validity.
Click Get SIGWX Chart or Get WINTEM Chart to view only the selected validity (this will be displayed in a layout for printing, and so the requested map may appear with the wrong orientation on the screen) or click Loop Charts to view all available charts (this allows you to view the requested map in the correct orientation on the screen and to move through all validities using the control buttons).
Use the drop down menus to select the required chart and validity for either ‘Analysis’ or ‘Prognosis’ Charts. Click Get MSL Chart to view only the selected validity (this will be displayed in a layout for printing) or click Loop MSL Chart to view all available charts for the region selected (this allows you to move through all validities using the control buttons).
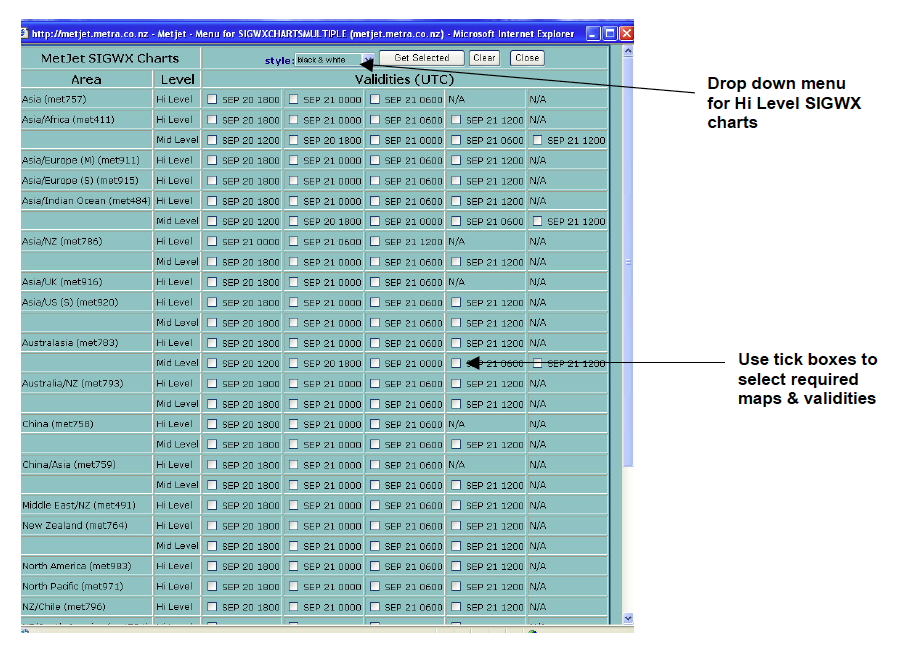
If you want to view a number of charts at one time use the Get Multiple SIGWX Charts, Get Multiple WINTEM Charts, Multi Analyses and Multi Prognosis buttons.
If Get SIGWX Chart, Get WINTEM Chart or Get MSL Chart buttons are used, you have the option to enlarge the image once it is displayed in the new window. This is done by clicking on the ENLARGE button. The image will be displayed in a new window. Close the window to return to the original screen when finished.
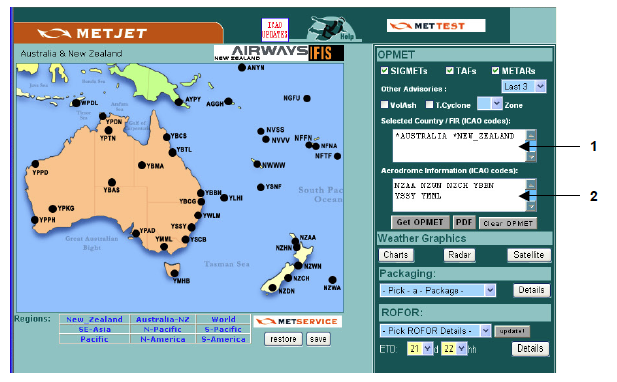
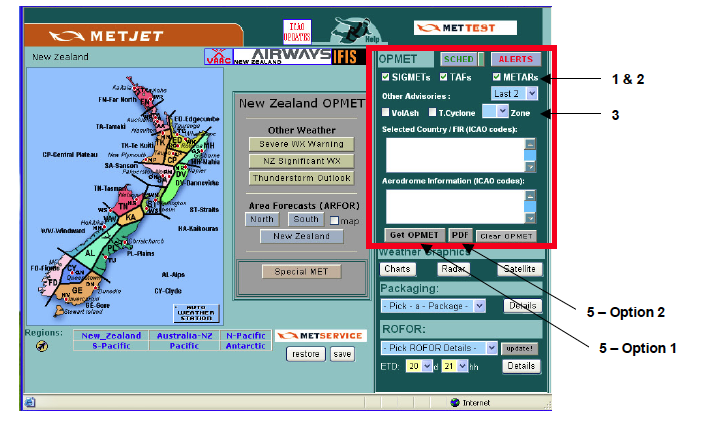
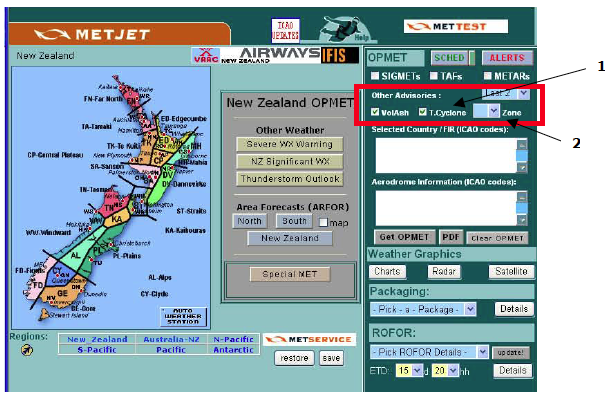
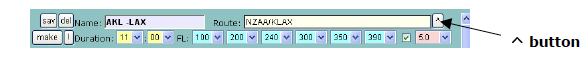
Route Forecasts (ROFORs) can be obtained using the OPMET section of the control panel.
When requesting a ROFOR the ETD or take-off time is required. This can be supplied as a default giving the current time or is prompted for.
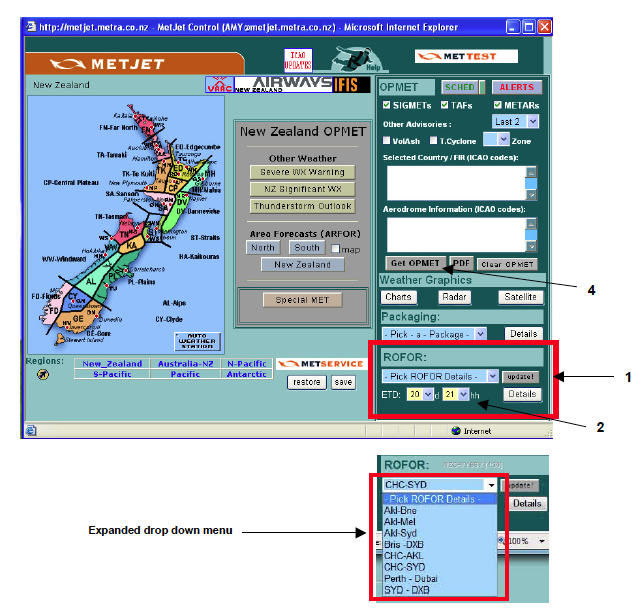
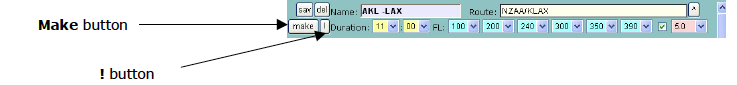
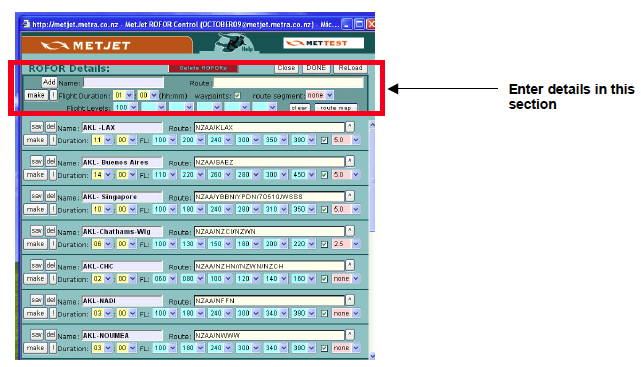
A ROFOR is defined and added to the drop down menu by editing and adding from the Details button.
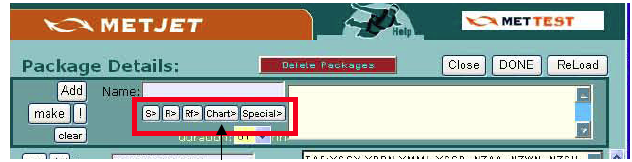
The packaging function allows you to create a single package for related charts, ROFORs and OPMET which can be used routinely or as a one-off.
Before you begin creating packages you must be familiar with:
Refer to the following sections if you are unsure VIEWING WEATHER GRAPHICS, VIEWING TAFs, METARs and SIGMETs, ROFORs
Previously created packages are located in the drop down menu in the Packaging section of the main page.
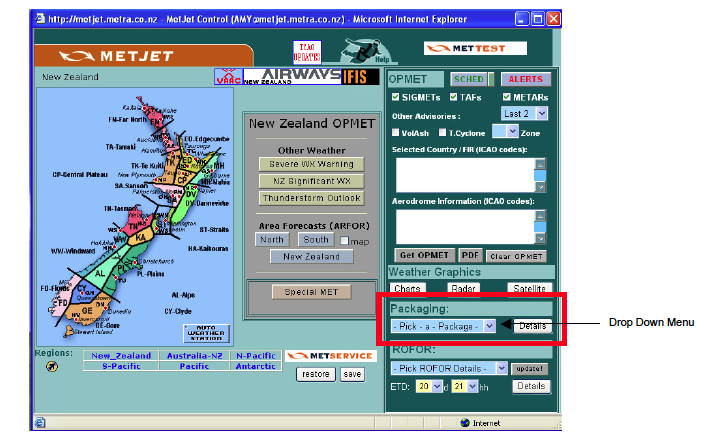
To select a package that has already been created select the required package from the drop down menu, then click the Get OPMET button.
The package will be loaded in a separate window from here you can view, print or save the package.
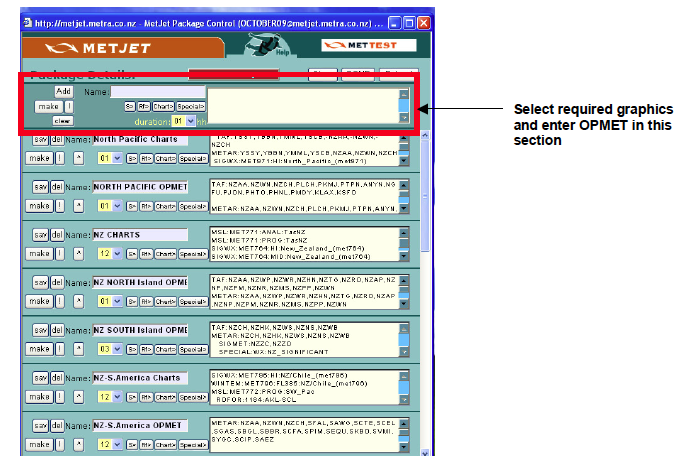
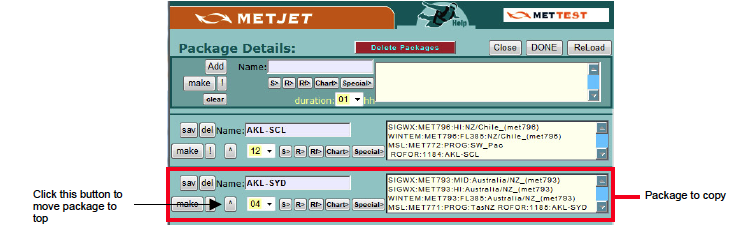
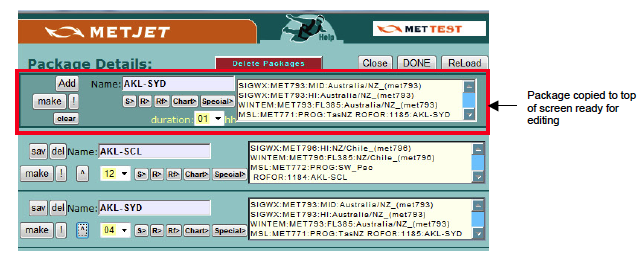
Where package contents only differ slightly from one another you can copy existing packages and modify them as follows:
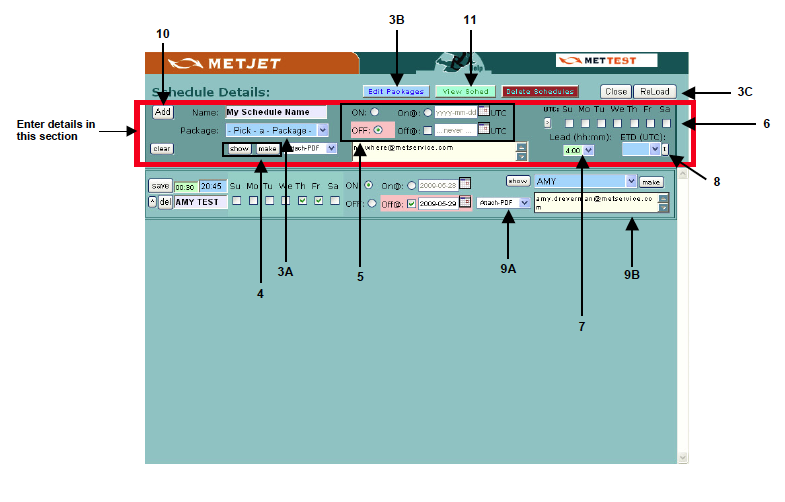
Click on the down arrow alongside Attach-PDF (9A) to select the format of the package.
The default is PDF, and arrives as an attached PDF.
Other choices are as an attached HTML or Text or,
Enter an email address or addresses (separated by a comma) in the email address box (9B). eg ray.thorpe@metservice.com, amy.dreverman@metservice.com
Type inthe fax number of the required destination eg 00682 23288
Type in the email address (or addresses) and the fax number (or numbers), separated by a comma.
Eg amy.dreverman@metservice.com, 00682 23288
The alerting function allows you to select which aerodrome locations require close monitoring for significant changes in the aerodrome forecast (amended TAFs) or the actual weather observations (SPECIs).
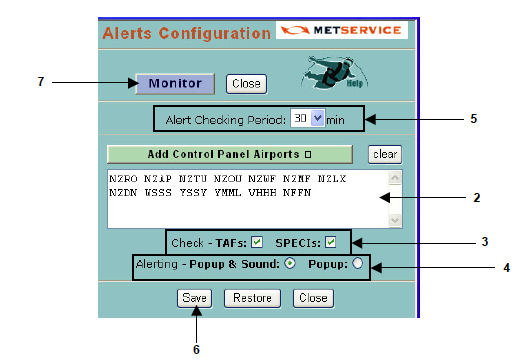
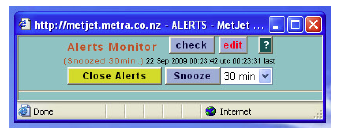
The Alerts Monitor box will remain in the bottom right hand corner of the screen while monitoring is in progress.
The check button allows you to instantly check for any alerts in-between the time interval selected initially.
The edit button allows you to make changes to the aerodromes you are monitoring or the time interval set, when done click the save button, then click the Monitor button to reset.
The Snooze button allows you to reset the time interval at which the nominated airports / aerodromes are checked.
The Close Alerts button disables the monitoring process for the alerts set up. To re-activate monitoring click the ALERTS button on the main screen then click Monitor.
When a change is detected the monitoring box will pop up in the top left hand corner and the box will change to red.
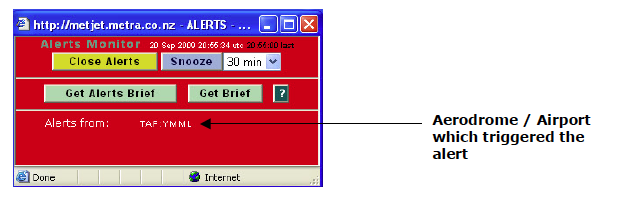
A scrolling message will list the aerodrome / airport which triggered the alert and will list whether it was a TAF or a SPECI.
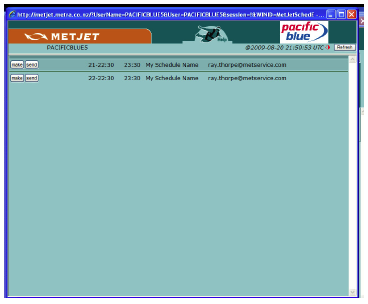
The Get Alerts Brief button – Provides a new window containing the amended TAF and / or SPECI from the Aerodrome / Airport which triggered the alert.
The Get Brief button – provides a new window containing the latest TAFs and the last two METARs from all aerodromes / airports being monitored. The aerodrome / airport which triggered the alert will be in bold.
Snooze button – once alerts have been checked by the user this sets it back to monitoring mode for the duration set using the drop down box.
The Close Alerts button disables the monitoring process for the alerts set up. To re-activate monitoring click the ALERTS button then click Monitor.
1 minute data is available for a number of airports throughout NZ via the MetConnect website. (Access to this information is available on a monthly subscription basis).
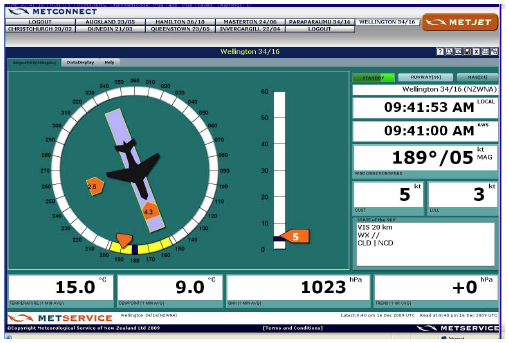
RED: when fields are red (as indicated in the image below) this indicates that the data is not current ie more than 10 minutes old (if the fields remain red please contact the MetService Service Desk on 04 470 0817 to report the problem).
YELLOW: when fields are yellow (as indicated in the image below) this indicates that the data is more than 1 minute old.
WHITE: when fields are white (as indicated in the image below) this indicates that the data is up-to-date.
Drop Zones
FTPA link to the RNZAF FTP Directory is found at the top of the main MetJet Screen.
|
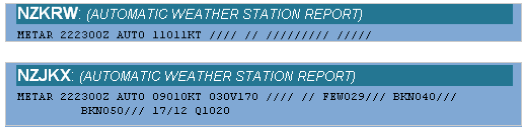
Only 3 aerodromes in New Zealand produce manual observations. They are Whenuapai (NZWP), Ohakea (NZOH) and Milford Sound (NZMF).
For each of these aerodromes, there are also AWS reports issued. To differentiate these AWS reports from the manual reports, the letter A is added to the ICAO location identifier i.e. NZWPA, NZOHA and NZMFA.
Observations from Automatic Weather Stations (AWS’) come in 3 distinct groups, these are:
These observations are issued every 30 minute as AUTO METARs. There are no manual observations from these locations. The reports are produced by fully automated state of the art AWS’ at NZ Aerodromes.
Identified by:
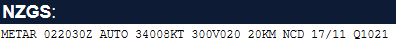
NZGS
METAR 222300Z AUTO 18006KT 120V230 20KMNDV / / BKN055/ / / 15/07 Q1027
EXAMPLE – AUTO METAR for NZGS
International Aerodromes
These are observations from the 3 ICAO Designated NZ International Aerodromes – Auckland, Christchurch and Wellington, in the full ICAO METAR code. This code differs from that used at all other NZ locations in that for visibilities greater than 10km, the term 9999 is used. In addition, at times when the weather is very good, the term CAVOK may be used to replace the visibility, present weather and cloud groups. CAVOK stands for Cloud And Visibility OK, and implies nil significant weather as well.
In addition, METAR AUTOs from NZAA, NZWN, and NZCH will include a Trend forecast appended to the end of the report.
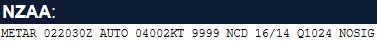
Identified by:
NZAAA:
METAR 022030Z AUTO 04002KT 9999 NCD 16/14 Q1024 NOSIG
EXAMPLE – AUTO METAR for NZAA
These limited observations originate from locations, which other than those at Whitianga and Ashburton, are sited primarily at non-aerodrome sites, scattered all over New Zealand which provide basic observations in METAR format for wind speed and direction, temperature, dew-point and pressure (QNH).
Identified by:
Eg. NZASA, NZCRX, NZSLW, NZKOE, NZOUT
A –based at an airport
X –not at an airport
W – wind only
E – no pressure given
T – temperature only
EXAMPLE – AWS Reports from locations at Kelburn and Kaitaia Hospital
Users will note small differences in the format of METAR AUTO reports, compared with the manual METARs currently produced. These differences relate to the nature of the sensors used to determine visibility, present weather and the height of the cloud layers.
|
Because the sensors are unable to scan the horizon and sky in the way that a human observer does, METAR AUTO will not include directional visibility variations, “vicinity” (VC) present weather or cloud type (i.e. TCU and CB). The exception to “vicinity” (VC) present weather is when the AWS does detect lightning between 8 to 16 km of the aerodrome, then “VCTS” is reported in the present weather field. Users should also be aware that the observations of visibility and cloud give conditions at and above the AWS sensors and may not be representative of conditions over other parts of the aerodrome or within 8km of the aerodrome, due to the location of the AWS and the area of scan. Also
These codes are illustrated in the following METAR AUTO examples: METAR NZWA 011430Z AUTO 35004KT 310V010 29KM -SHRA OVC048///1 19/16 Q1021 METAR NZWU 0219300Z AUTO 10014KT 46KM NCD2 14/10 Q1015 METAR NZOU 021400Z AUTO 13001KT 7000 DZ FEW015///1 BKN026///1 BKN031///1 16/15 Q1010 RERA METAR NZWB 181730Z AUTO 32001KT 0400NDV FG VV0013 06/05 Q1016
|
The table below indicates the OPERATIONAL RANGE of the Visibility Censors (km) and Ceilometers (feet) deployed at METAR AUTO LOCATIONS.
| Location ID | Aerodrome | Visibility Range KM | Ceilometer range (cloud base) ft | Implementation |
| NZGS | Gisborne | 20 | 25,000 | completed |
| NZHK | Hokitika | 20 | 25,000 | completed |
| NZNV | Invercargill | 50 | 12,000 | completed |
| NZKK | Kerikeri | 20 | 25,000 | completed |
| NZMO | Manapouri | 30 | 25,000 | completed |
| NZMS | Masterton | 30 | 25,000 | completed |
| NZNR | Napier | 20 | 12,000 | completed |
| NZNS | Nelson | 20 | 12,000 | completed |
| NZNP | New Plymouth | 20 | 25,000 | completed |
| NZPP | Paraparaumu | 30 | 12,000 | completed |
| NZUK | Pukaki | 20 | 25,000 | completed |
| NZRO | Rotorua | 50 | 12,000 | completed |
| NZAP | Taupo | 20 | 25,000 | completed |
| NZTG | Tauranga | 50 | 25,000 | completed |
| NZTU | Timaru | 30 | 25,000 | completed |
| NZWR | Whangarei | 20 | 25,000 | completed |
| NZWB | Woodbourne | 20 | 12,000 | completed |
| NZWK | Whakatane | 30 | 25,000 | completed |
| NZWU | Wanganui | 30 | 25,000 | completed |
| NZOU | Oamaru | 30 | 25,000 | completed |
| NZWS | Westport | 30 | 25,000 | completed |
| NZWF | Wanaka | 30 | 25,000 | completed |
| NZPM | Palmerston North | 50 | 12,000 | completed |
| NZDN | Dunedin | 50 | 12,000 | completed |
| NZHN | Hamilton | 50 | 12,000 | completed |
| NZQN | Queenstown | 50 | 12,000 | completed |
Automated METARs are provided at 30 minute intervals and include wind (direction and speed), visibility, cloud amount and height of base (but not cloud type), present weather, temperature, dew point, QNH and recent weather (i.e. precipitation observed since the last routine report).
In accordance with ICAO SARPs (standard and recommended practices), owing to the increased frequency of the METAR reports, when Automated METARs are produced every 30 minutes, SPECIs are no longer issued at METAR AUTO locations at NZ Domestic Aerodromes.
Lightning data from an independent lightning detection network is being used to provide additional observational data for the METAR AUTOs in conjunction with present weather sensors, to provide thunderstorm related present weather and recent weather. Thunderstorms are included when lightning strikes are detected within 16km of the aerodrome.
The table contains a list of aerodrome locations relevant to A SPECIFIC AVIATION AREA WINDS (AAW) ZONE for which Aerodrome AWS reports are available on MetFlight in METAR Format.
HOWEVER the table consists of 3 distinct groups of Aerodrome AWS reports namely:
Aerodrome locations for which FULL AWS reports are available:
Aerodrome locations for which AWS reports are available in the full ICAO METAR code are NZAAA, NZCHA, NZWNA. The full ICAO METAR code differs from that used at most NZ airfields in that visibilities greater than 10km will be reported as 9999, and occasionally the tern CAVOK will be used to replace the visibility, present weather and cloud groups combined. CAVOK stands for Cloud And Visibility OK, and implies no significant weather also.
Aerodrome locations for which Limited AWS reports are available for locations in New Zealand other than on aerodromes (Located at non-Aviation specific sites such as National Parks, roads etc). These Aerodrome Locations are designated by FIVE LETTER station identifiers ending with an X, e.g. NZCRX, NZBRX, NZSIX etc. (AVAILABLE ON REQUEST).
| Location Identifier and observation delineator | Location | AAW Zone |
| NZKK METAR AUTO | Kerikeri | FN = Far North |
| NZWR METAR AUTO | Whangarei Airport | |
| NZAAA | Auckland International Airport | TA = Tamaki |
| NZARA | Ardmore | |
| NZHN METAR AUTO | Hamilton Airport | TK = Te Kuiti |
| NZNP METAR AUTO | New Plymouth Airport | |
| NZTG METAR AUTO | Tauranga Airport | ED = Edgecumbe |
| NZWK METAR AUTO | Whakatane Airport | |
| NZRO METAR AUTO | Rotorua Airport | |
| NZAP METAR AUTO | Taupo Airport | CP = Central Plateau |
| NZGS METAR AUTO | Gisborne Airport | MH = Mahia |
| NZNR METAR AUTO | Napier Airport | |
| NZMS METAR AUTO | Masterton | DV = Dannevirke |
| NZWU METAR AUTO | Wanganui Airport | SA = Sanson |
| NZPM METAR AUTO | Palmerston North Airport | |
| NZPP METAR AUTO | Paraparaumu Airport | ST = Straits |
| NZWB METAR AUTO | Woodbourne Airport | |
| NZWNA | Wellington International Airport | |
| NZNS METAR AUTO | Nelson Airport | TN = Tasman |
| NZKIX | Kaikoura | KA = Kaikouras |
| NZWS METAR AUTO | Westport Airport | WW = Windward |
| NZHK METAR AUTO | Hokitika Airport | |
| NZMFA | Milford Sound | FD = Fiords |
| NZMO METAR AUTO | Manapouri Airport | |
| NZCHA | Christchurch International Airport | PL = Plains |
| NZTU METAR AUTO | Timaru Airport | |
| NZOU METAR AUTO | Oamaru Airport | |
| NZUK METAR AUTO | Pukaki | AL = Alps |
| NZQN METAR AUTO | Queenstown Airport | CY = Clyde |
| NZWF METAR AUTO | Wanaka Airport | |
| NZDN METAR AUTO | Dunedin Airport | GE = Gore |
Non Aviation Automatic Weather Stations (AWS) not located at aerodromes – Available to MetJet users on request
HINT: If you only wish to view METARs, then remove the ticks from the TAF (current) and SIGMET boxes.
(within 8km of the aerodrome datum point)
| QUALIFIER | WEATHER PHENOMENA | |||||||||||||||||||||||||||||||||||||||||||||||||||||||||||||||||||
| INTENSITY OR PROXIMITY | DESCRIPTOR | PRECIPITATION | OBSCURATION | OTHER | ||||||||||||||||||||||||||||||||||||||||||||||||||||||||||||||||
|
|
|
|
|
||||||||||||||||||||||||||||||||||||||||||||||||||||||||||||||||
| Altocumulus | AC |
| Altostratus | AS |
| Nimbostratus | NS |
| Stratocumulus | SC |
| Stratus | ST |
| Cumulus | CU |
| Cumulonimbus | CB |
| Towering Cumulus | TCU |
Cloud amount is reported in oktas by using the following letter abbreviations:
| SKC | Nil cloud |
| FEW | 1 - 2 Oktas |
| SCT | 3 - 4 Oktas |
| BKN | 5 - 7 Oktas |
| OVC | 8 Oktas |
| METARs/SPECIs/TAFs:- | Cloud heights are defined in hundreds of feet above aerodrome level |
| GRAFORs:- | Cloud heights are defined in feet up to 10,000 ft AMSL |
| GNZSIGWX:- | Cloud heights are defined in feet up to 10,000 ft AMSL, and as Flight Levels (FL100) at 10,000 Feet and above. EG 15,000ft = FL150. |
| SIGMETS:- | Cloud heights are defined in feet up to 10,000 ft AMSL, and as Flight Levels (FL100) at 10,000 Feet and above. EG 15,000ft = FL150. |
| AMD | Amended |
| PROB | Probability |
| BECMG | Becoming |
| TEMPO | Temporarily |
| NSW | No significant weather |
| FZL | Freezing Level |
| NSC | No significant cloud |
RADAR stands for RAdio Detection And Ranging. Weather radar transmits pulsed beams of microwaves and listens for their echoes from precipitation. The weather radar can infer precipitation intensity (with some limitations) and location from the strength of the echo, the time taken for it to return, and the location from which it came. Precipitation intensity can be determined by using the scale alongside the image.
A radar image is made up of a number of sweeps of the radar beam at different elevations. Because the beam is straight and the earth is curved, the beam climbs away from the earth's surface with increasing distance from the radar. At 50km distance from the radar, precipitation can be detected down to 0.5km above the height of the radar; at 240km distance from the radar, precipitation can be detected down to 5.5km above the height of the radar. Thus, precipitation at some distance from the radar might go undetected because it is underneath the beam.
There is no guarantee that precipitation detected by the radar will reach the earth's surface. In some circumstances, precipitation may partially or completely evaporate as it falls. A lot of precipitation begins its life in the cloud as hail or snow and melts before it reaches the earth's surface. Ice and water-coated ice scatter the radar beam in different ways from water droplets. When interpreting radar images, one has to bear in mind that echoes from frozen precipitation are very likely to be present and consider how these might change as the precipitation falls.
Not every echo on a radar image is precipitation. Occasionally, ground clutter and sea clutter can be seen, even though MetService has routines which remove most of this. Sometimes, the radar beam can bounce along in a narrow duct near the earth's surface and show echoes which are from well beyond the radar's range. Both of these sorts of echoes tend not to move much. Occasionally wave cloud and severe icing can be seen on the image, especially to the east of the country.
Mountains block the radar beam very effectively. This effect is seen often on images from the Canterbury radar, where there can be strong boundaries - caused by the Southern Alps - between where precipitation appears to be and not to be. Very heavy precipitation scatters the radar beam so effectively that it can block echoes from precipitation that is further away from the radar, in much the same way that mountains do. This attenuation of the radar beam can lead to radar images which display precipitation over a far smaller area than it actually covers. MetService operates rain radars at nine locations from the far north (near Kaio) to Invercargill Airport in the south. A tenth, planned for the central Otago region will complete the network in due course.
Satellite imagery on this site is obtained from geostationary meteorological satellites. Geostationary meteorological satellites maintain a fixed position relative to the earth. They are positioned about 36,000 km above the equator and complete one orbit every 24 hours. Satellite images are issued hourly in UTC time.
There are two main kinds of satellite image; visible (VIS) and infra-red (IR). Each has advantages and disadvantages. It is important to remember that satellites look down on the top of a cloud while we are used to looking up at them. This means that layers of thin high cloud can look threatening on a satellite picture, while at the surface we look up and see a high cirrus overcast, but an otherwise sunny day. Conversely when we are in thick fog the top of the fog layer is relatively low and quite close in temperature to the surface of the earth so it may not seem too bad on an infra-red picture.
As well as VIS and IR imagery, you may also have the choice on MetJet to select image loops for other parts of the globe. The NZ-Tasman option is a wide-angle view of New Zealand, the Tasman Sea and eastern Australia, while the NZ option provides more detail by zooming in on New Zealand.
These can be thought of as black and white photographs taken from the satellite of the clouds below. If it is dark (i.e. night-time) the camera will not have enough light and the picture will be black. For this reason they are not the best option to use for 24 hour monitoring of the weather. In the middle of the day, when the sun is highest, clouds will be illuminated most brightly. At dawn and dusk when the sun angle is low you may be able to see shadows cast by higher clouds on those below them. This can be a useful aid to understanding what type of cloud you are looking at. The thicker the cloud is the brighter it will appear on the screen.
Infra-red (IR) images are the result of the satellite sampling the infra-red (long-wave) radiation which upwells from the earth's surface and atmosphere based on their temperature. The images show the temperature of the radiating surface - that is, the temperature of land, sea or cloud top. The NZ-Tasman and Australian animated images depict the sea and land surfaces as false-coloured blue and green respectively. Because infra-red radiation is emitted by cloud tops and the earth's surface continuously, infra-red images are available at any time of the night or day.
The public can reasonably interpret the following from the IR satellite imagery shown here:
Satellite images will show areas of cloud but will not show rainfall. On the other hand, radar shows areas of rainfall but tends not to detect cloud that is free of precipitation.
Cloud top images represent the approximate height of clouds tops, based on temperature, using a colour scale, for easy interpretation.
| Key | |
| Purple/Red | FL400 – FL450 |
| Yellow | FL300 – FL400 |
| Green | FL200 – FL300 |
| Blue | FL100 – FL200 |
| Greyscale | FL050 |
When we look at everyday objects we identify them based on their size, shape (which may include texture), colour, and how they behave. When looking at satellite pictures we can use the same sort of concepts to identify the cloud we are looking at, and if we can recognise the cloud we can infer something about the weather that accompanies it.
Satellite images cover a vast area, while our normal frame of reference is limited to how far we can see out the window. A cloud that completely covers the sky as we see it, may actually be only a few kilometres across and show up on the satellite picture as a tiny speck.
Large organised cloud structures tend to be associated with the weather systems marked on weather maps such as fronts, highs and lows. Very small clouds may be smaller than the resolution of the satellite. In this case an average of the clear and cloud-covered fraction will be shown in the pixel.
This is often related to size, in that small scale features such as thunderstorms tend to be uneven and bumpy in appearance. Small features are often more variable in the weather they produce for example showers and sunny breaks.
Smooth, flat looking clouds are formed when air over a large area slowly moves upwards. The weather that comes with them is often slower to change, but when it does the change will last longer, as in the case of persistent rain clearing.
In visible pictures the denser a cloud is, the brighter it appears - there is no direct indication of how high the cloud is. When the sun angle is low you can sometimes see shadows which can indicate layering in the clouds.
In infra-red pictures the higher the cloud is, the colder is its top and the brighter it appears in the image. Colour is used to highlight the coldest temperatures.
By looking at both a visible and an infra-red image you can better identify clouds. For instance low cloud may be hard to detect in an infra-red picture since it is nearly the same temperature as the background, while on a visible image you will see a bright cloud mass but have no idea how high or active the cloud is.
The blocking effect of mountainous terrain often shows up quite clearly on satellite pictures. On cold mornings areas of fog can be seen trapped in inland valleys, while on showery wintry days you can clearly see how the land blocks the progress of the showers. When strong winds blow across mountains you can also get wave clouds forming downstream of the ranges, just like the ripples following a submerged rock in a stream.
Just as a low is beginning to form the cloud often gathers into an inverted comma shape with the head of the comma being close to the area of lowest pressure and the tail streaming out representing the cold front.
If cloud is getting bigger it is often a sign that the weather system is becoming more active particularly if the tops of the cloud are getting colder.
Even on a single picture you can get an idea of motion from a satellite picture and when they are looping it is unmistakable. Low pressure systems spin clockwise in the Southern Hemisphere, while highs rotate gently anticlockwise. The direction of the wind can also be seen in the motion of clouds, though you must remember that the clouds are not at the ground - both wind speed and direction aloft are not always the same as those at the surface. Cloud streaks that move very quickly may be associated with jetstreams travelling at over 200 km/h high in the atmosphere.
There are two forms of weather chart available at this site:
A mean sea level analysis is a contour chart of the atmospheric pressure at mean sea level for a given time in the past. It is one of many possible "snapshots" of the atmosphere's state at a given past time.
A mean sea level prognosis is a contour chart of the expected atmospheric pressure at mean sea level for a given time in the future. A mean sea level prognosis is one of many possible "snapshots" of the atmosphere's expected state at a given future time. Because the forecast weather depends on the mean sea level prognosis, MetService forecasters keep the mean sea level prognosis under constant review. This is one of the reasons why there are two issues of prognoses each day. It is also why you should ensure you always have the most up-to-date prognosis and forecast.
The isobar patterns on both the analysis and prognosis charts show the main weather systems (that is, highs, lows and tropical cyclones) together with significant fronts and troughs.
| Chart Valid At | Chart Available At | ||
| NZST | NZDT | UTC | |
| 0000UTC | 1500 | 1600 | 0300 |
| 0600UTC | 2100 | 2200 | 0900 |
| 1200UTC | 0300 | 0400 | 1500 |
| 1800UTC | 0900 | 1000 | 2100 |
| Chart For | Chart Available At | ||
| NZST | NZDT | UTC | |
| 24 Hours Ahead | 1200, 0000 | 1300, 0010 | 0000, 1200 |
Isobars (iso = equal, bar = pressure) are lines which join points of equal atmospheric pressure. Some isobars have numbers on them showing this value in hectoPascals (hPa). To a first approximation the wind at the surface blows parallel to the isobars, and the closer they are the stronger the wind. This relationship does not always hold, however. In particular, it may not be true when hilly or mountainous ground influences the flow of air - which is very often the case in and around New Zealand.
When isobars enclose an area of high pressure this is called a high or anticyclone and its centre is labelled on a weather chart with an 'H'. In the Southern Hemisphere, winds go around anticyclones in an anticlockwise direction. The central pressure of a weak anticyclone is about 1015hPa, while a strong or intense anticyclone has a central pressure above about 1030hPa. An intensifying anticyclone has a rising central pressure, while a weakening anticyclone has a falling central pressure.
Near an anticyclone's centre are light winds and sometimes areas of low cloud (and maybe even drizzle) called anticyclonic gloom. Round the edge of an anticyclone, the winds are sometimes strong. Intense anticyclones tend to squeeze the isobars together creating areas of strong winds. Winter anticyclones often bring frost; summer anticyclones may bring thunderstorms and hail. The bigger anticyclones are, the slower they tend to move, sometimes 'blocking' the weather systems following them.
When isobars enclose an area of low pressure this is called a 'low' or 'depression' and its centre is labelled on a weather chart with an 'L'. In the Southern Hemisphere, winds go around depressions in a clockwise direction. The central pressure of a shallow depression is above 1000 hPa, of a moderate depression 980-1000 hPa, and of a deep or intense depression below 980hPa. If there are two or more centres the depression is said to be complex. If the central pressure is rising the depression is said to be filling or weakening; if the central pressure is falling the depression is said to be intensifying or deepening.
The mid-latitudes is a region of contrast between the warm air of the topics and the cold air of the polar regions. It is in this region of temperature contrast that depressions form. The southwards (and clockwise) movement of relatively warm air and northwards (and clockwise) movement of relatively cold air in depressions is often associated with strong winds and rain.
Tropical cyclones are also areas of low pressure and the winds go around them in a clockwise direction (in the Southern Hemisphere). Unlike depressions though, they form only in the tropics and have quite a different character. They are marked on weather charts with the symbol 'T'. A tropical depression is only considered to be a tropical cyclone when the wind near its centre is gale force (34 - 47 knots) or stronger. Because of their destructive potential, tropical cyclones are given names. By the time these systems move into the New Zealand area their character has changed subtly and, strictly speaking, they are no longer tropical cyclones.
An air flow originating from a prescribed location (warm, cold, moist or dry) is called an air-mass. Air-masses are named according to where they have come from and each has its own characteristic temperature and humidity.
The air-masses reaching New Zealand are generally either maritime polar or maritime tropical. While air masses themselves cannot be seen on weather charts, the boundaries between them, which are called fronts, can often be.
The boundary between warm and cold air is marked by a front and often coincides with a change in wind direction and speed, temperature, humidity, weather type and pressure.
A cold front is the leading edge of an invading colder air-mass and is marked by a line with triangles pointing to where it is moving. Cold fronts push in underneath the warmer air ahead of them, forcing the warm air upwards and making cloud and areas of rain. The cloud band is usually about 50 to 400 kilometres (30 to 200 nautical miles) wide. As a cold front passes by: any rain clears but showers may appear, humidity drops, air temperature usually drops, pressure rises and the wind changes direction.
A warm front is the leading edge of an invasion of warmer air. Its surface position is marked by a line with semicircles pointing to where it is moving. The advancing warm air rises over a zone of retreating cooler air, making a cloud bank that slopes forwards from ground level upwards, often bringing prolonged steady rain. This cloud bank can be 500 to 1000 kilometres (270 to 540 nautical miles) wide. As a warm front passes by: any rain becomes patchy but humidity remains high, air temperature may rise a little, pressure steadies, and the wind changes direction.
Often, but not always, the most severe weather is found along the front itself and close to the area of lowest pressure.
An occluded front or occlusion occurs when a cold front overtakes a warm front, so that all that remains of the original warm air is trapped above, where it cools making dense cloud and rain. It is marked by a line with triangles and semicircles on the same side, pointing to where the front is moving. As an occluded front passes by: any rain becomes patchy, wind eases, the rate of pressure fall may level out but air temperature does not change much.
A stationary front is one which has lost its impetus for movement, so that neither air-mass is making much progress. It is marked by a line with alternate triangles and semicircles on opposite sides ... the triangles protruding into the warmer air-mass and the semicircles protruding into the cooler air-mass. It takes a while for a stationary front to pass by: any rain clears only slowly and temperature and pressure do not change much.
When isobars make a sharp bend around a depression, this bend area is called a trough of low pressure or simply a trough. Troughs are also often shaped like tongues and usually contain weather similar to depressions and fronts. Troughs are drawn on weather charts (as a single solid line) if they mark a significant change in the weather (wind direction and/or speed, precipitation, temperature).
Horizontal convergence is the coming together of two flows of air. When these two flows of air are from different air masses and significant cloud and weather result, the resulting line of convergence is commonly drawn as a front. However, when these two flows of air are in the same air mass and significant cloud and weather result, the weather feature is drawn as a convergence line. Convergence lines are only drawn in the tropics. A convergence line is drawn on a weather map as a continuous line with barbs on either side at regular intervals. It looks something like barbed wire.